Help
Contact Us
If you are having issues and require assistance, please contact [email protected]
Feedback or Suggestions
We welcome feedback and suggestion related to the State of Hawai‘i Behavioral Health Dashboard please use the form below:
Walkthrough – How To Navigate The Dashboards
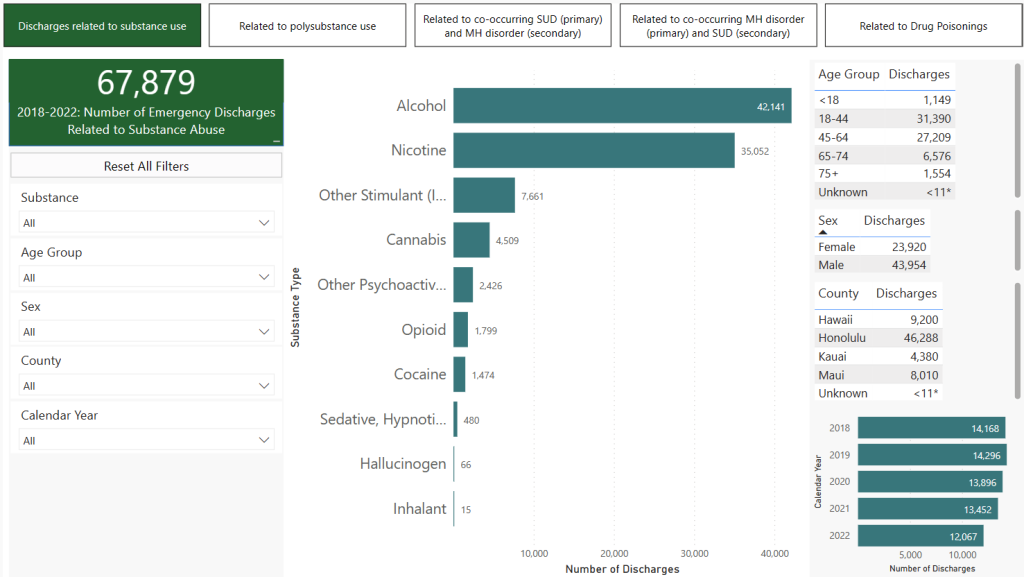
The controls of each dashboard are essentially the same. If the dashboard has tabs along the top, start off by determining which one is the best fit for what you are looking for. For the sake of this example, we’ll use the “Emergency Department Discharges” dashboard default tab “Discharges related to substance use” view, with no filters currently in use, as shown here.
To begin filtering the data set, click on a drop-down list, button, date selector or slider as appropriate in the left side filter area. You will notice the values adjust accordingly. For example, say our ultimate goal is to get a count of all discharges related to substance use including Alcohol, in Honolulu, in the 18-44 age range, in 2021. To start, we first select “Honolulu” county, which gives us the following result. Note “Alcohol” counts have dropped from 42,141 to 26,889.
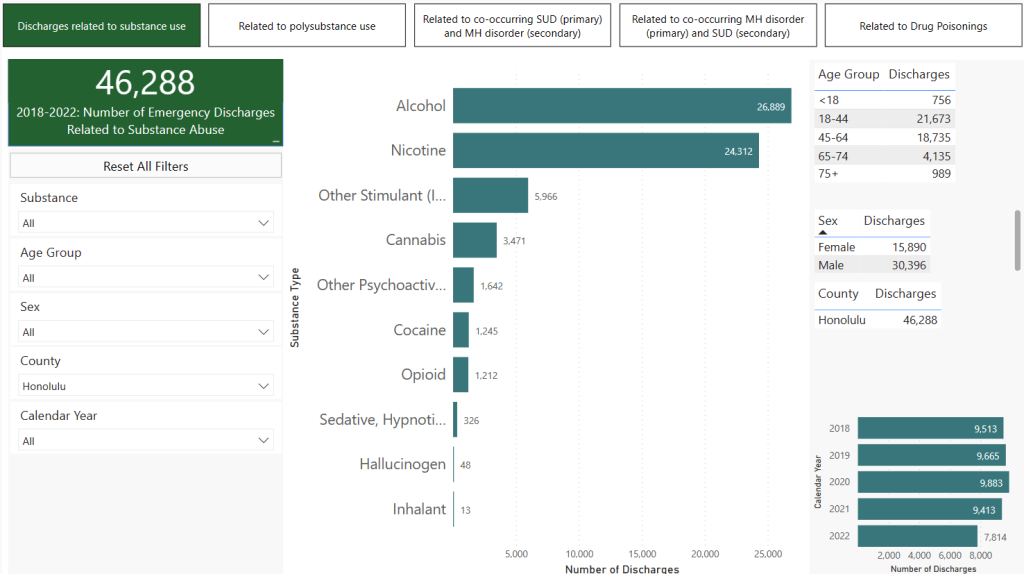
Once “Honolulu” county is selected, all the other charts and graphs in the view are automatically adjusted to be limited to that filter. To accomplish additional filtering, select what you wish to filter on and it will combine with the existing filter. To continue with our example, we do this and select on “18-44” in the Age Group and “2021” in the “Calendar Year”, which gives us the following result.
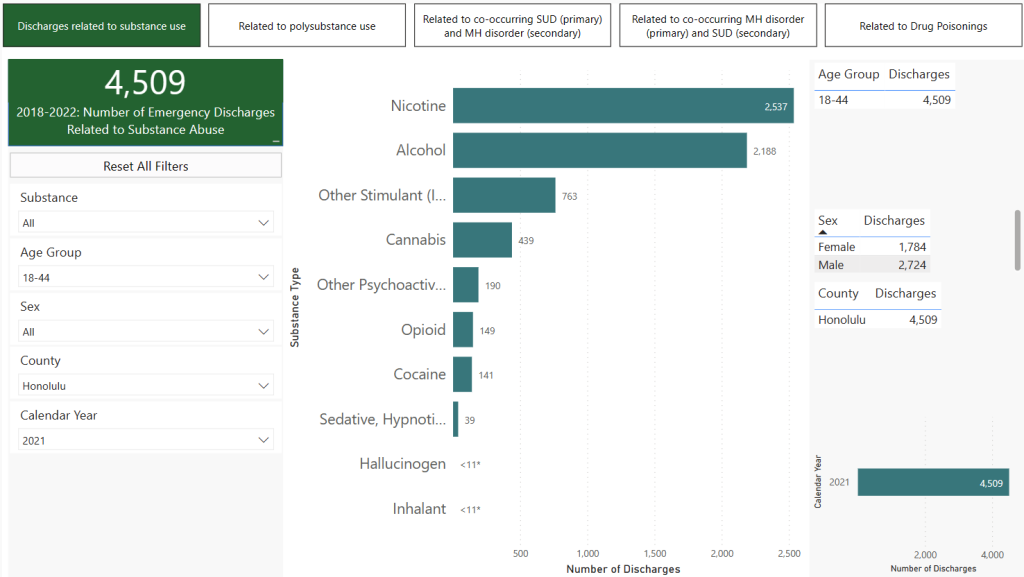
As a result, the Alcohol count has dropped to 2,537 and all the other tables and charts have adjusted accordingly as well. Note that Alcohol is no longer the top substance as Nicotine is now larger. At this point, we’ve met our original goal, but let’s say we decide we want to investigate those who also have Adult Personality and Behavioral Disorder? To explore this, click on the “Related to co-occurring SUD (primary) and MH disorder (secondary) tab button at the top of the dashboard. Then select the filters as we did earlier for “Honolulu” for county, “18-44” for age group and “2021” for calendar year. Now select “Schizophrenia, Schizotypal, Delusional or Other Non-Mood Psychotic Disorder ” from the “Mental Health Diagnosis” dropdown. This results in the following dashboard view.
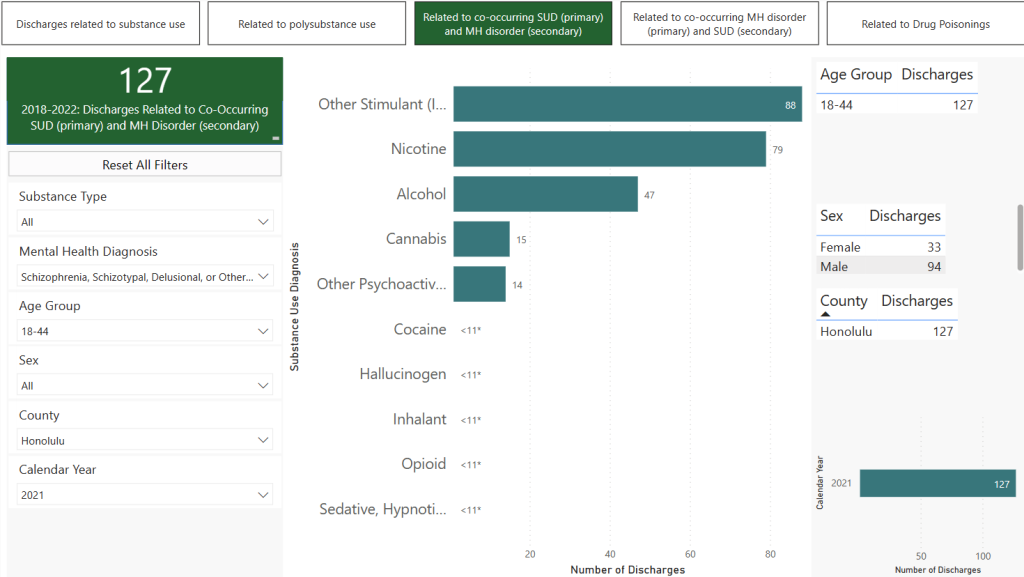
The count for Alcohol results has dropped to 47 and “Other Stimulants” is now the top substance . Should you decide you want to include another age group in which you have already selected an item, you can hold the “CTRL” key and click another box in the dropdown and it will be added to the filtering along with the original selection. For example, let’s say we decided to include the 45-64 age group.
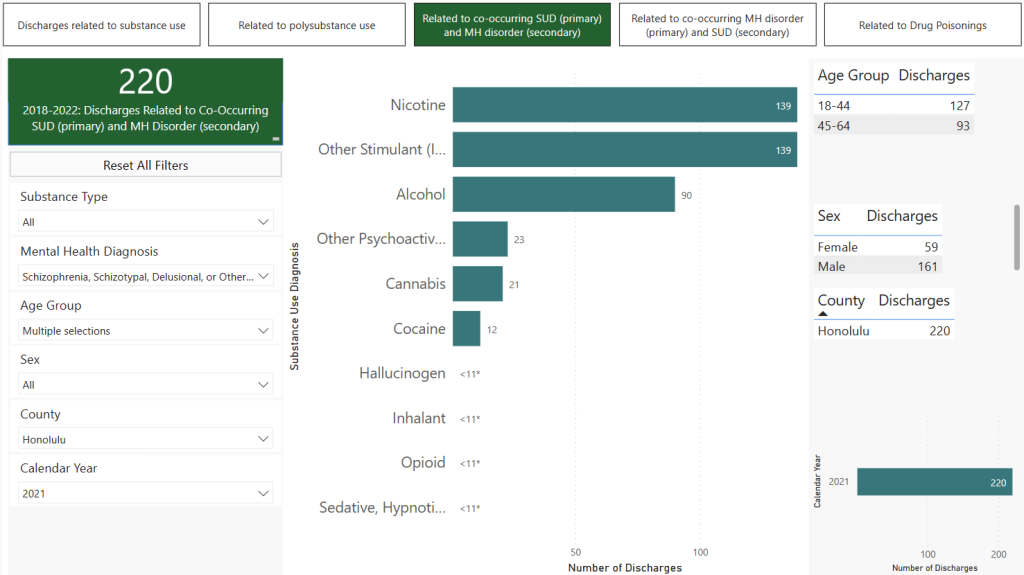
Now the numbers and charts have all adjusted to reflect the additional age group. This also works for deselecting an activated filter as well. Say we want to go back to just the 18-44 age group, we control-click on the 45-64 age group which deselects it and reverts us back to our earlier result. To reset all the filters at the same time, click the “Reset Filter” button located under the green box on the left.
One final thing to be aware of, notice that in our final screenshot, some of the rows and bars say “<11*,” this happens when there are fewer than 11 results for that category under the current filtering conditions. These numbers are obfuscated per State Department of Health policy.